Tag: TSLA
-
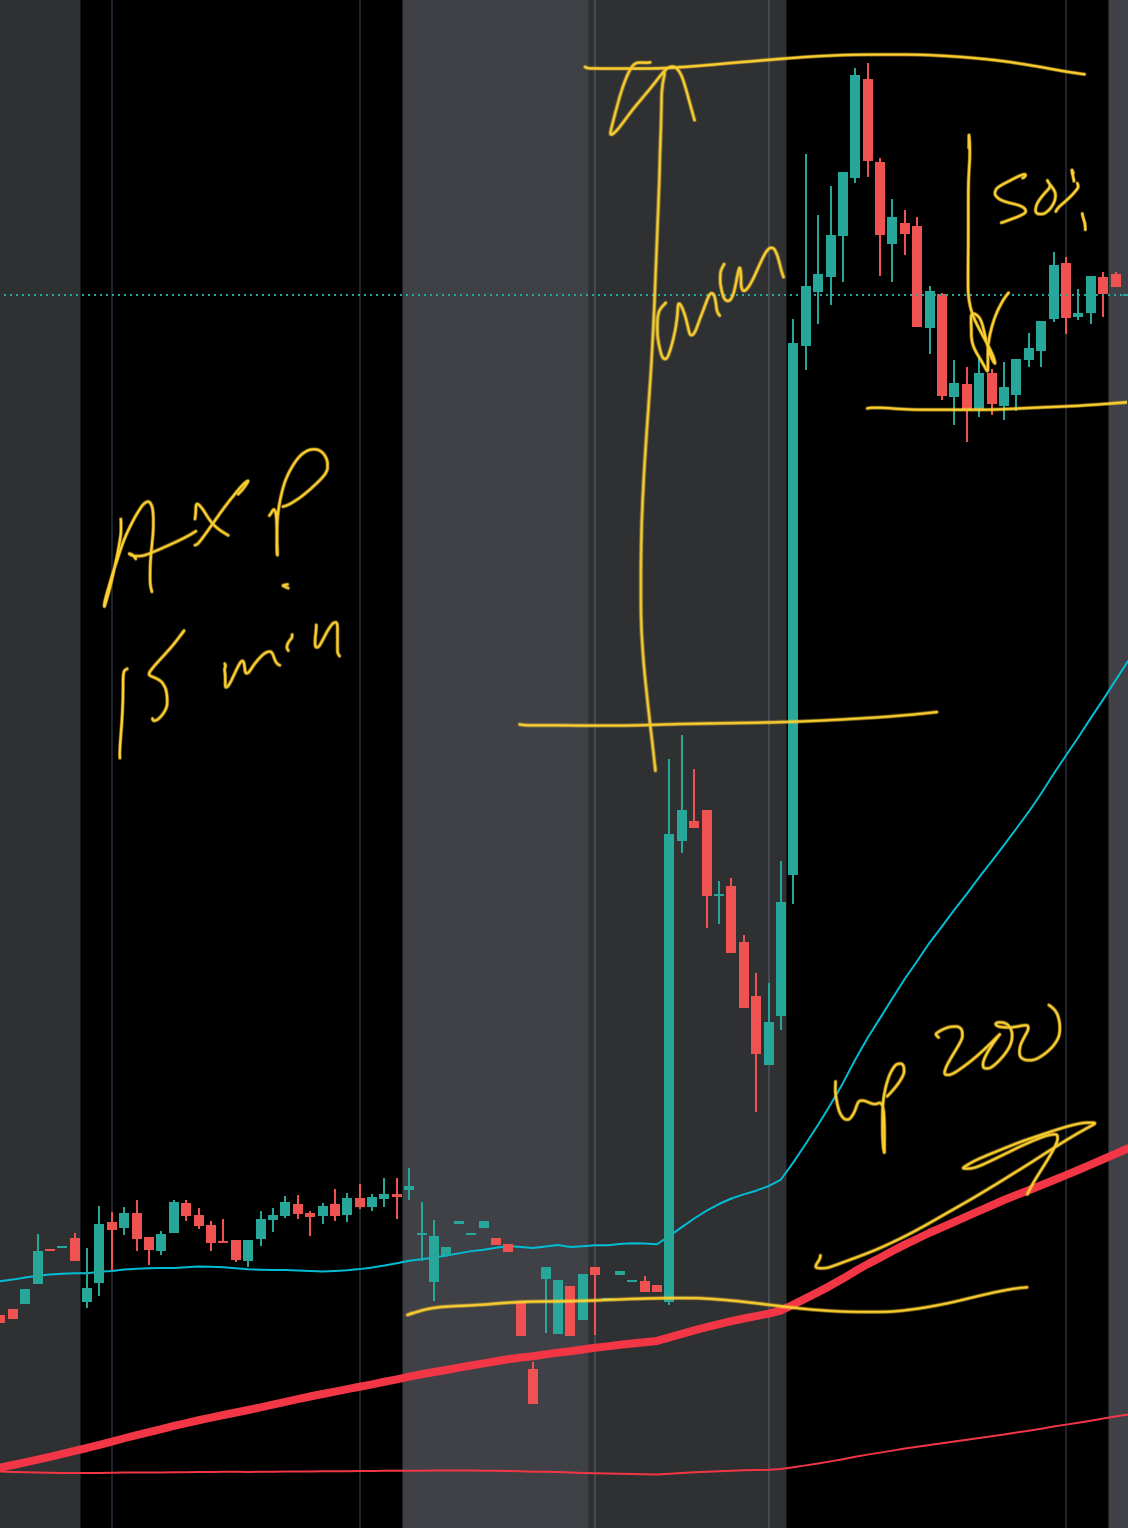
Flat Upward Market, Watching AMD, AXP, MSFT, TSLA, on Friday, Jan 26, 2024
Inflation indicator had a good reading. Tech layoffs continue. AXP gave good guidance. AMD bounced up from an overnight pullback. AMD and MSFT showed support on the 15-minute 200 SMA. TSLA still weak. Strategy Long only. Buy under the 15-minute 200 SMA if 200 SMA is going up. AMD, MSFT. Gapping dividend stocks, upward 200…
-
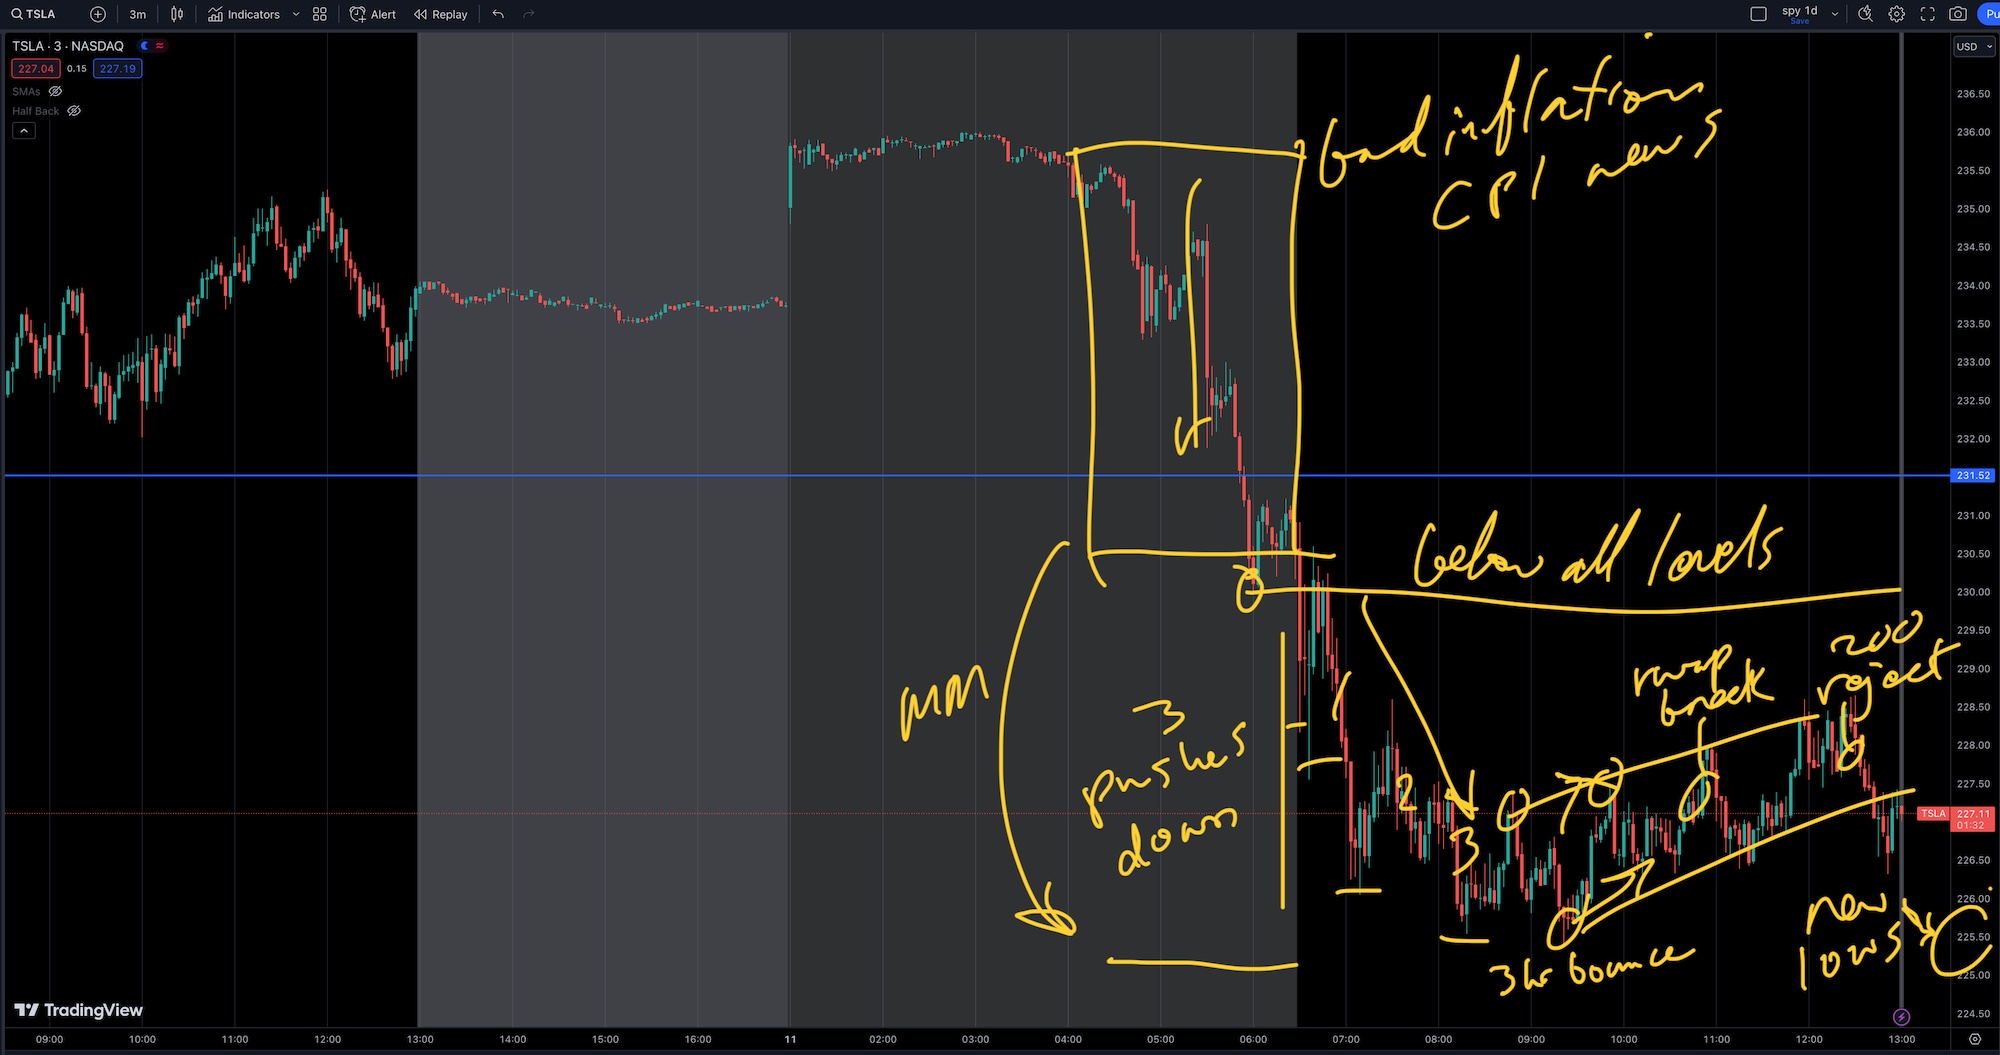
TSLA Intraday Price Action, Break Down Below the 200 SMA on Bad CPI on Thu, Jan 11, 2024
Backdrop Market was slightly positive. Bad inflation reading sent stocks down early. Bitcoin ETFs are born. Daily Chart Red candle breaking prior lows, touching lower range of prices from October. Now below the 200 SMA. Day range was modest at 73% ATR. Notable drop in ATR from the 10’s for many months to now below…
-
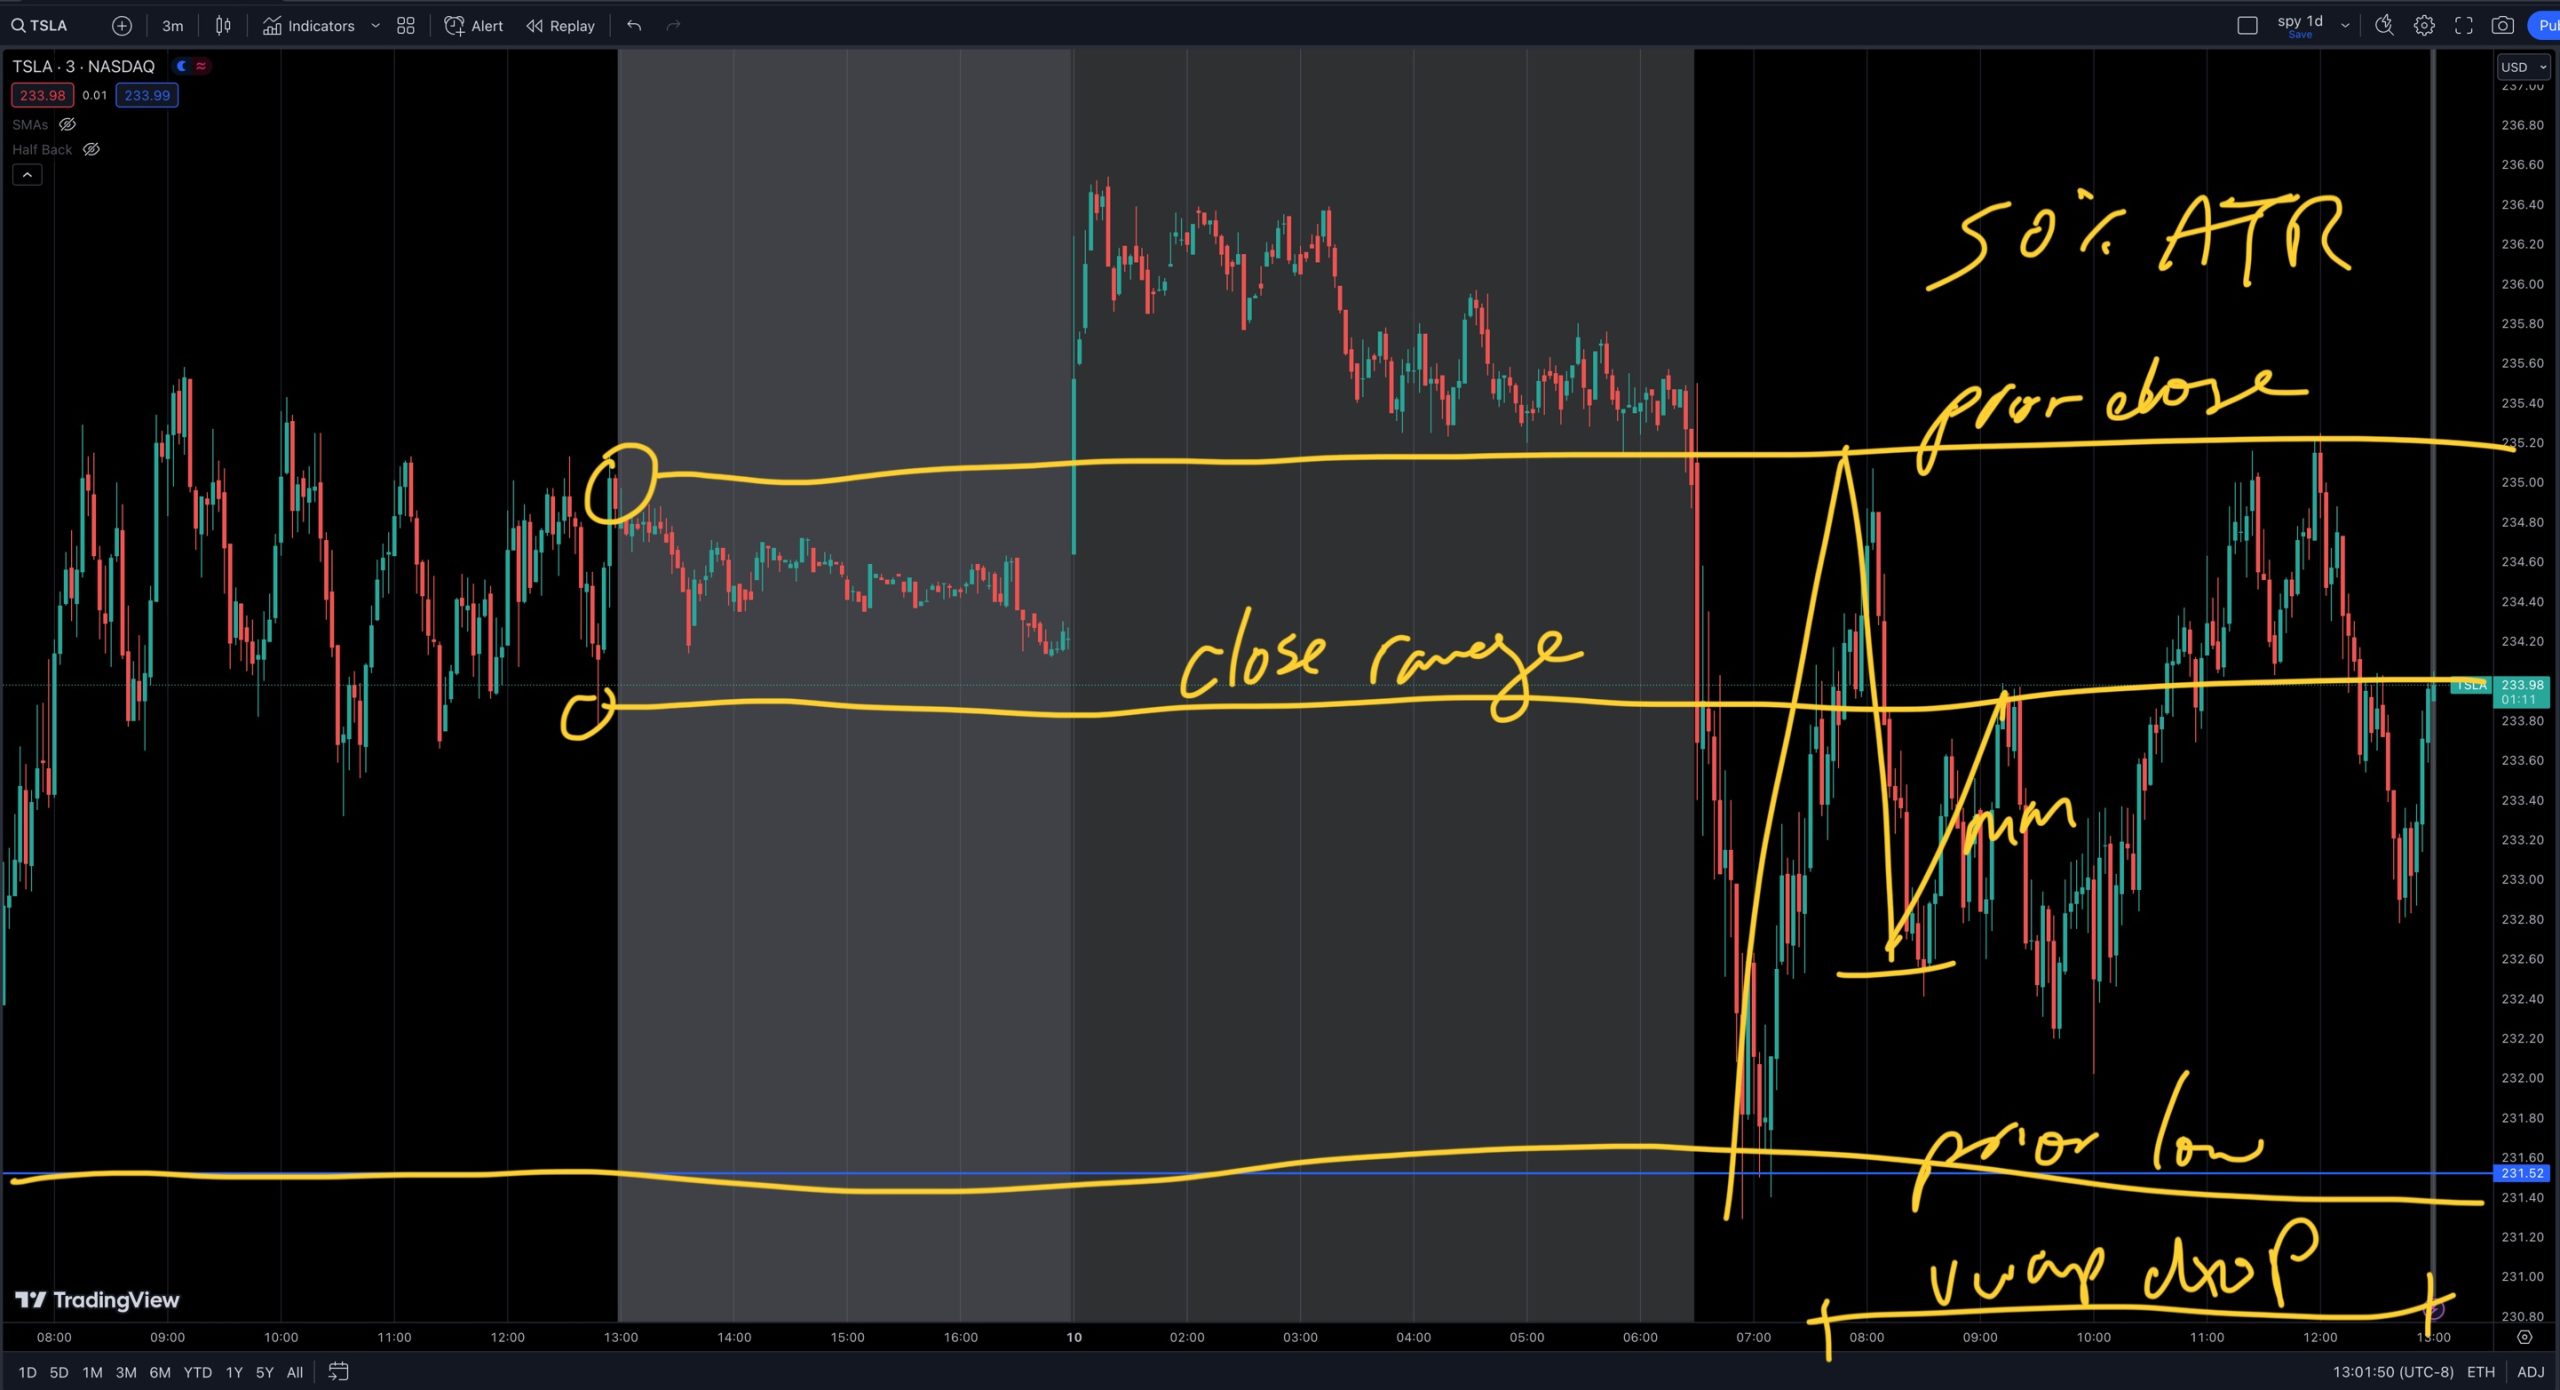
TSLA Intraday Price Action, Consolidation on Wed, Jan 10, 2024
Backdrop Market was slightly positive. Daily Chart Red candle at the bottom of the range from November. Just above the 200 SMA. Day range was tight at just above 50% ATR. 3-Minute Chart Price ranged all day between the previous day low and previous day close. Initial move was down, albeit chopily. Bounced all the…
-
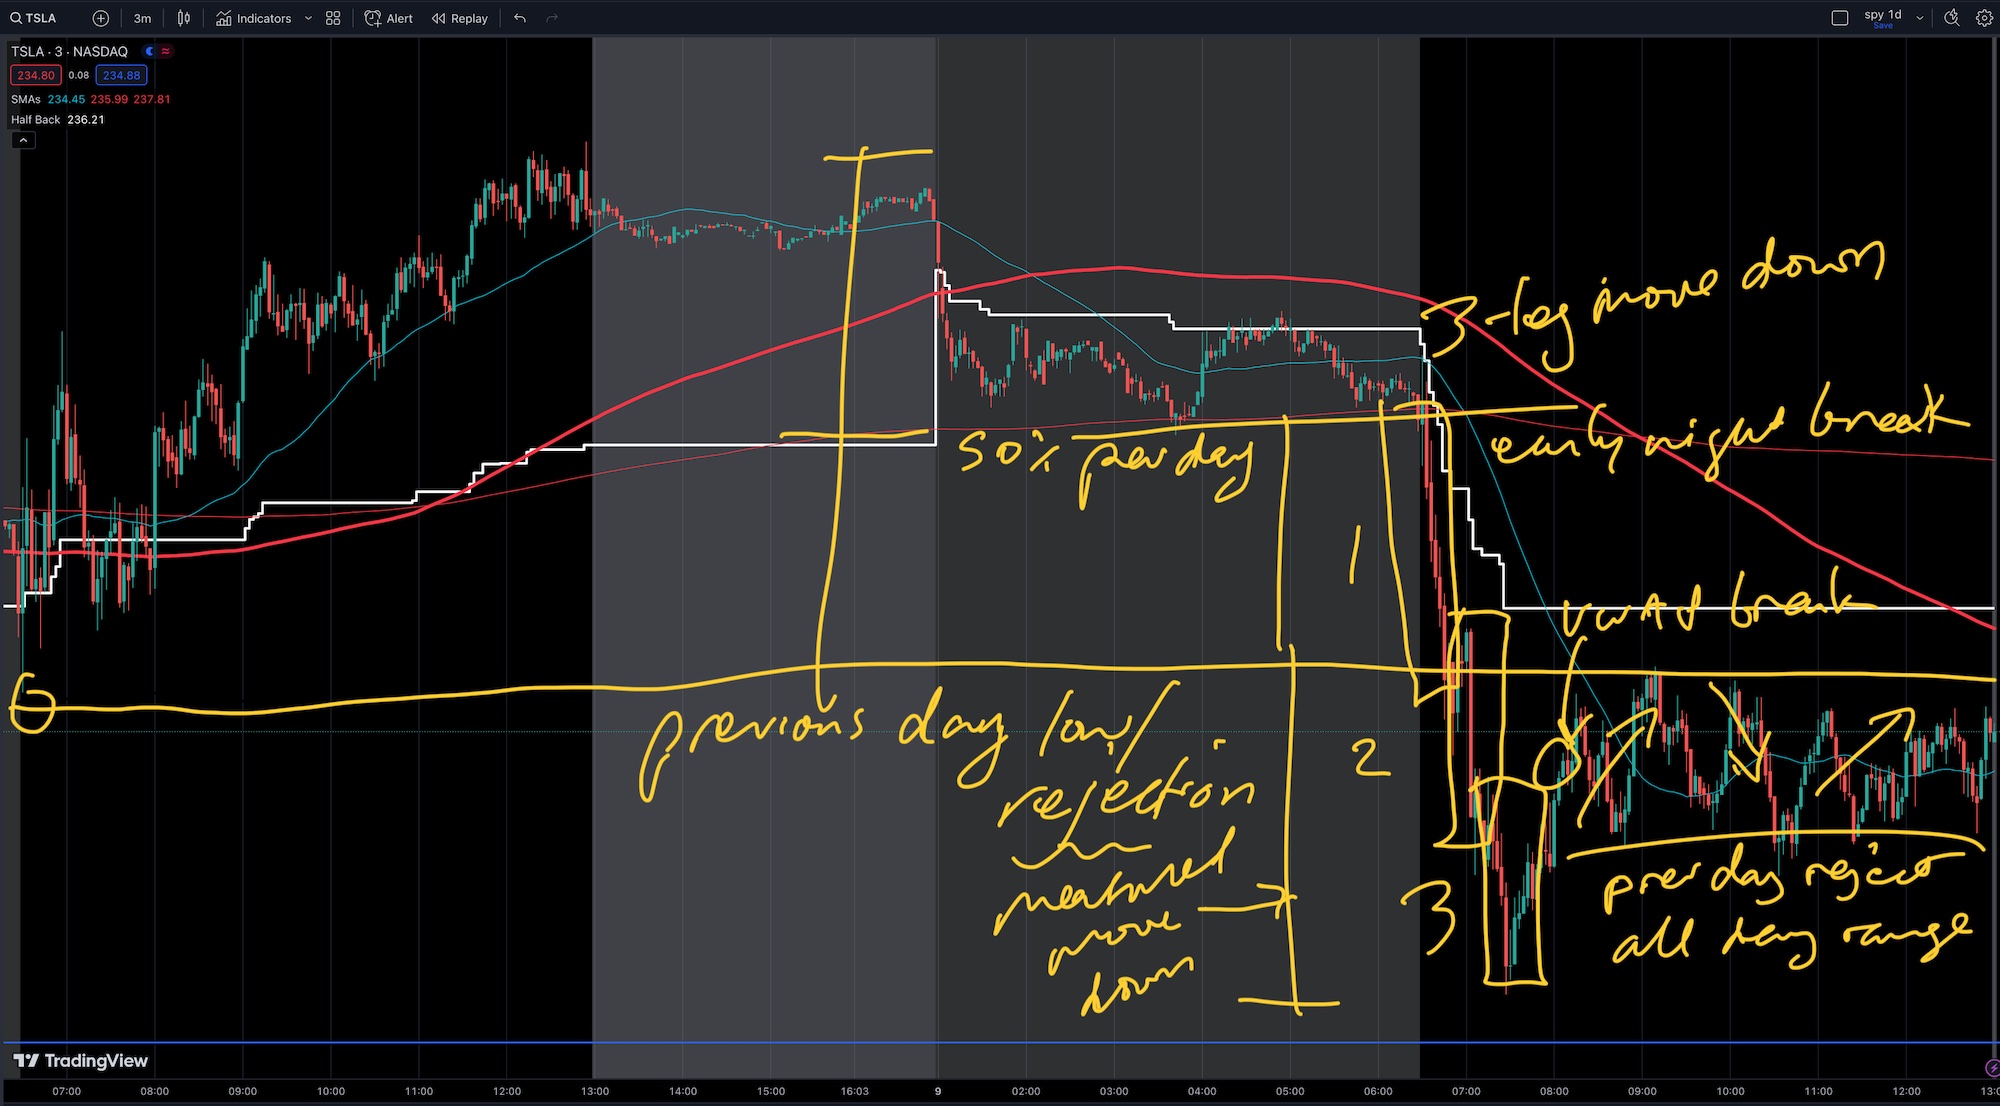
TSLA Intraday Price Action, Prior Day Rejection on Tue, Jan 9, 2024
Backdrop Market starts down and runs up to break even. Lower volume. Daily Chart Red candle that rejected the prior green candle. Day range was average. 3-Minute Chart Night range low was 50% level of prior day. Early break below night range. Early downward direction with 3 pushes. Downward ended at a bounce at the…
-
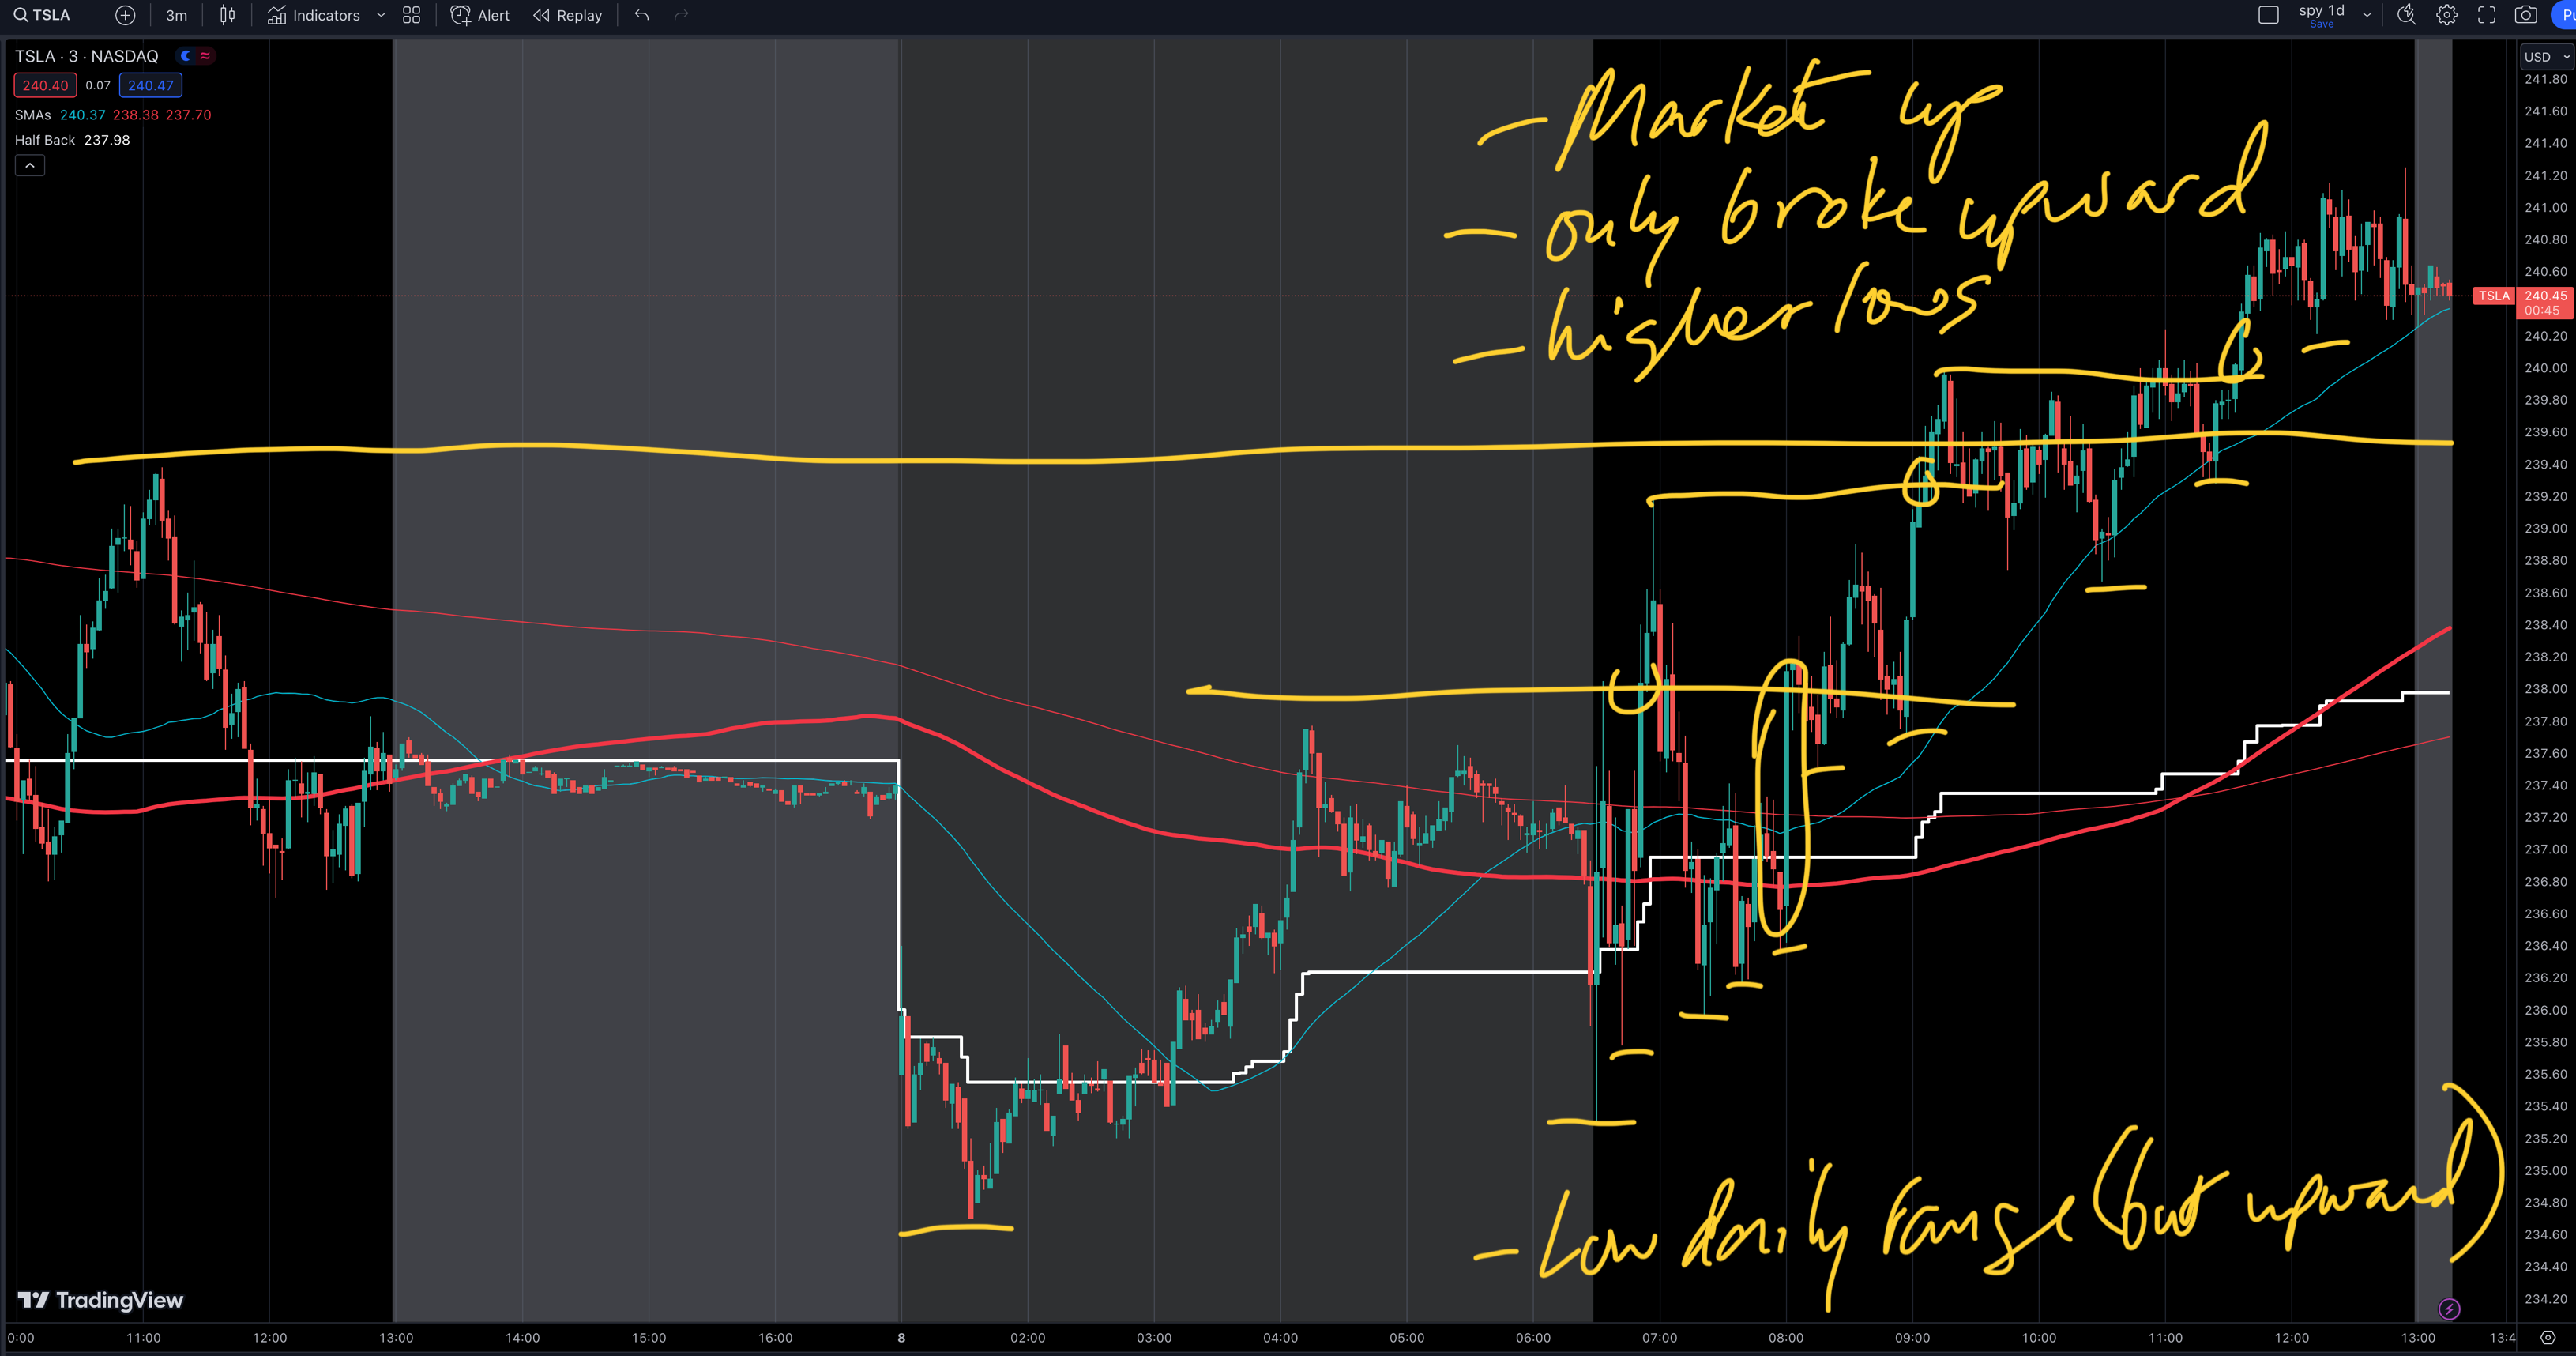
TSLA Intraday Upward Price Action, Market Up, Low Volume on Mon, Jan 8, 2024
Backdrop Up day for the market. Lower volume. Articles trying to paint Elon as a drug addict. Daily Chart Even though range was below ATR, it was a definite green candle on the daily. 3-Minute Chart Early ranging, but price only broke upward, and never went below night range. Big green candle in the first…
-
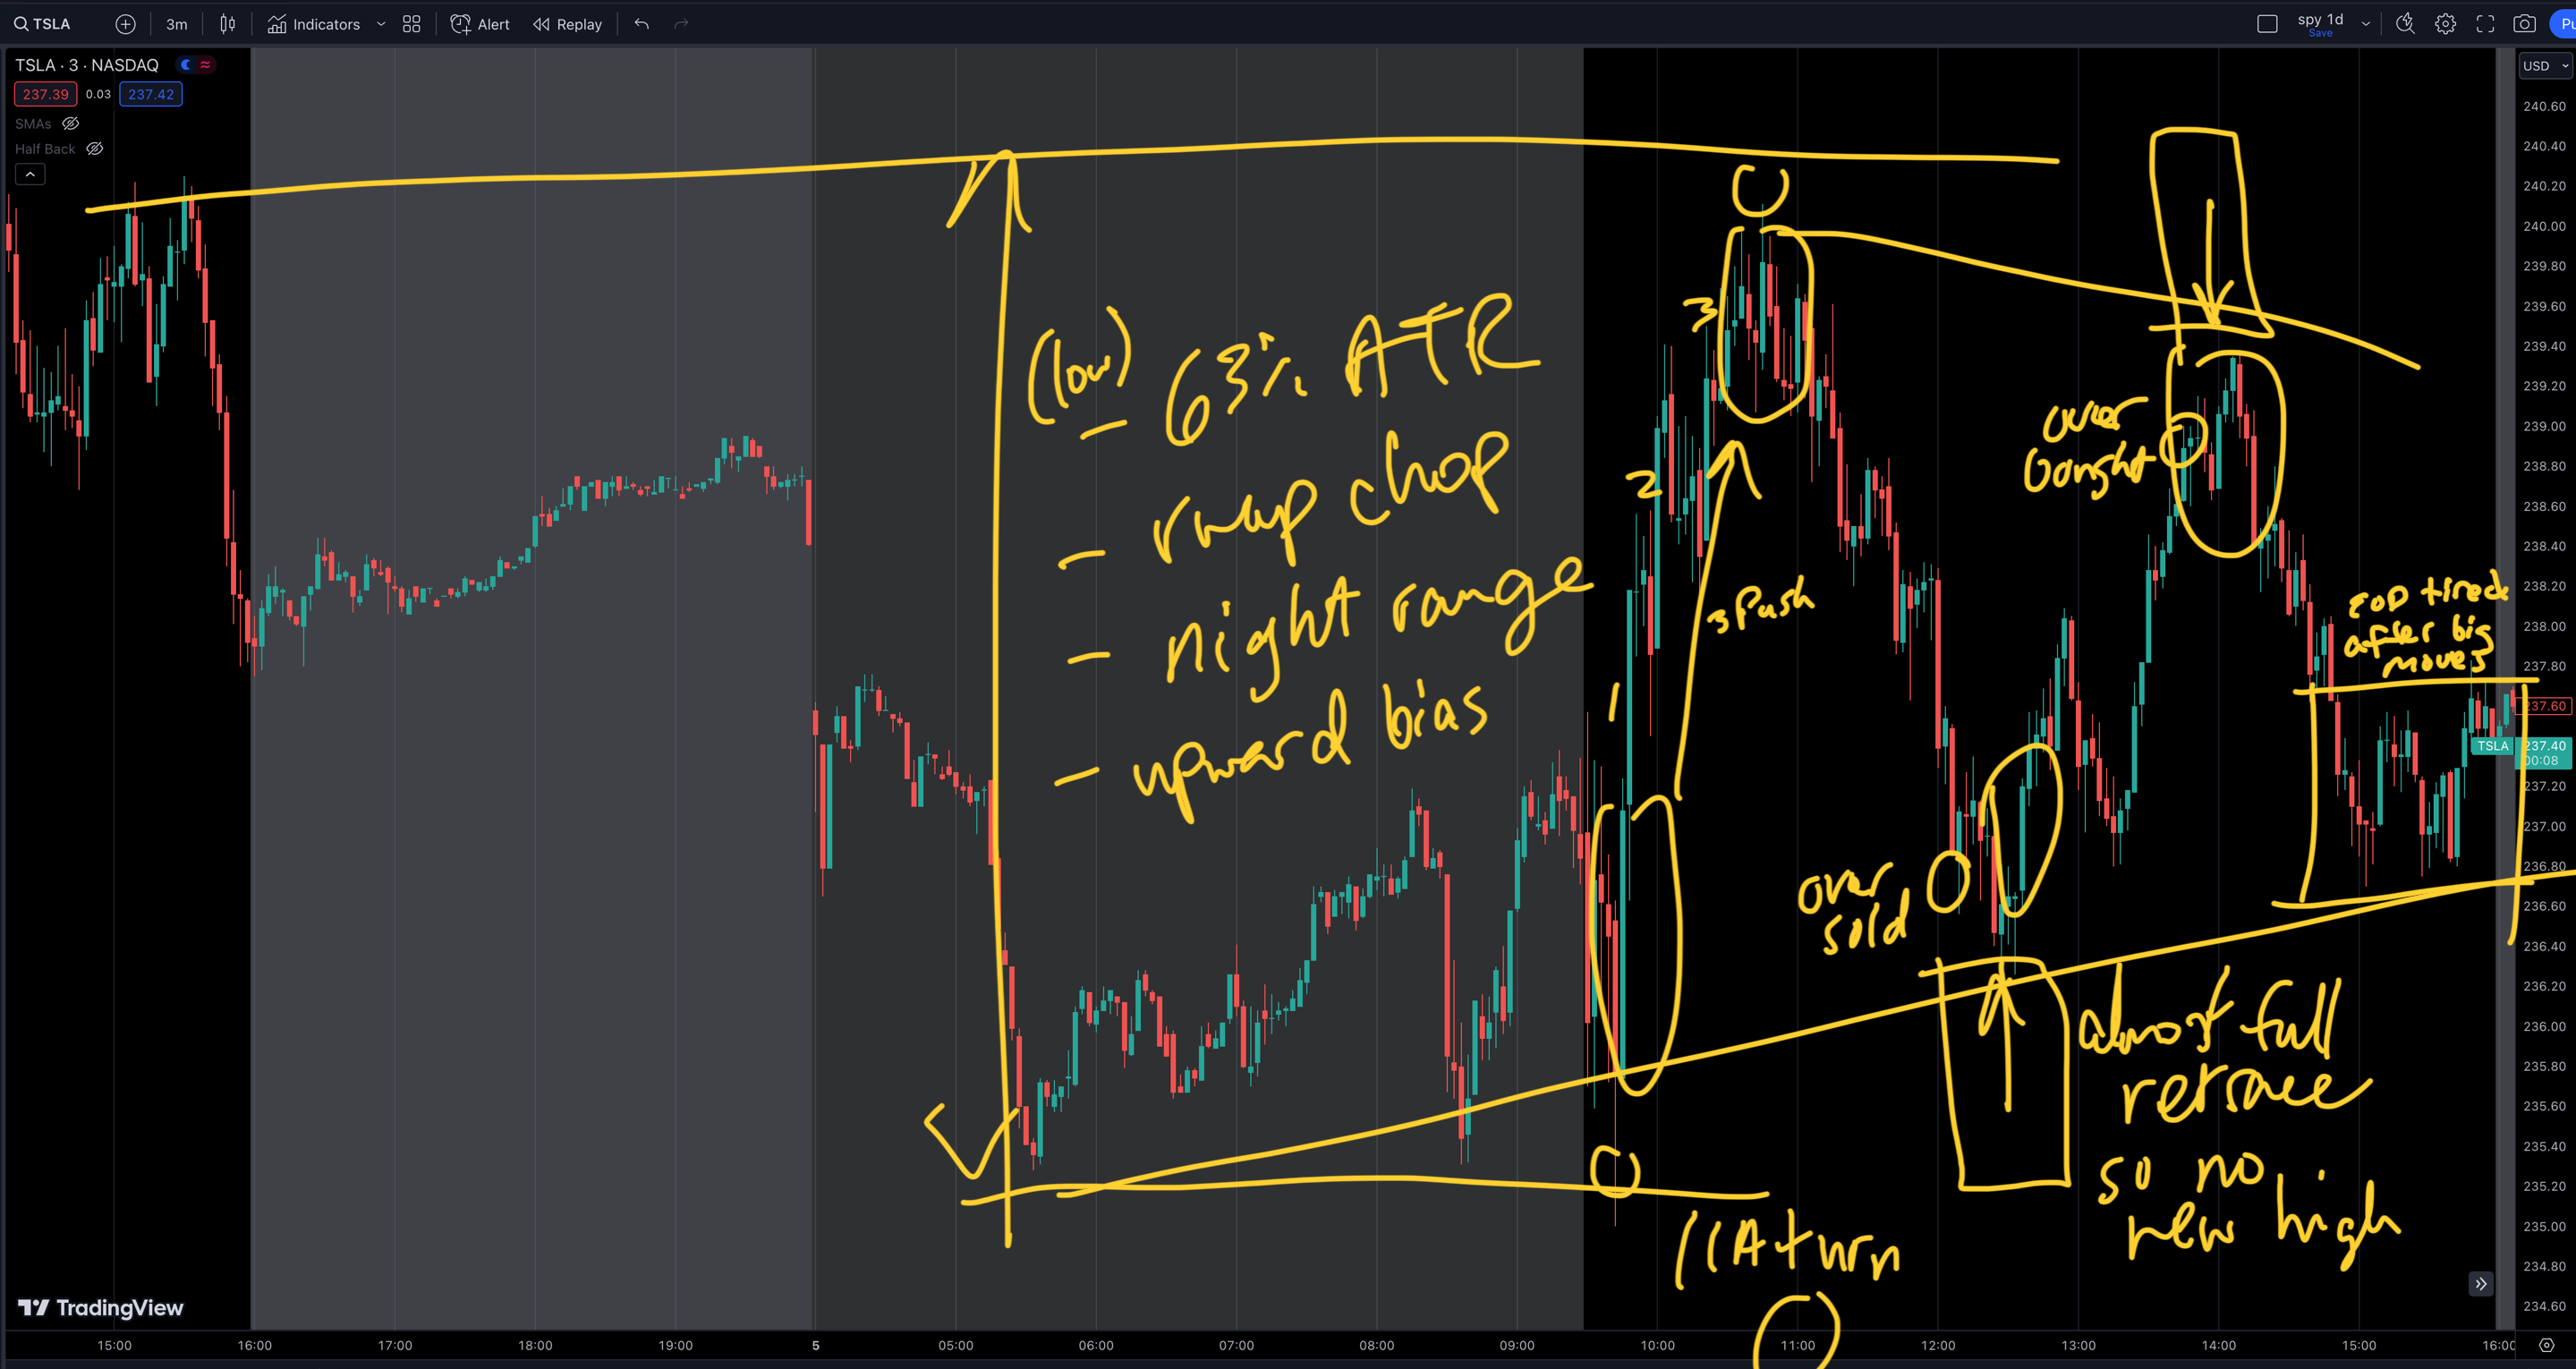
TSLA Intraday Ranges, Downward Pause, Low Market Volume on Fri, Jan 5, 2023
Backdrop Surprisingly strong employment numbers. EV tax credits future skepticism. Car margins shrinking. Market down days might need a break. Daily Chart Flat day with slight upward bias after 5 prior downward days. 3-Minute Chart 4 good swings followed by flat close. Consolidating price stayed within the night range, with low daily range at 63%…
-
-
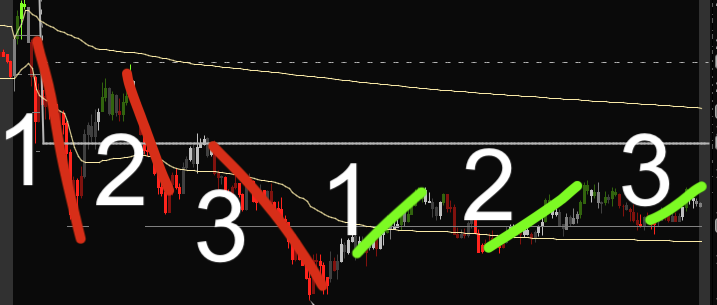
Friday TSLA Drop Under $200
The day range beat yesterday, having a somewhat strong downward direction, hovering below $200, with a range of 110% ATR.