Backdrop
Market starts down and runs up to break even. Lower volume.
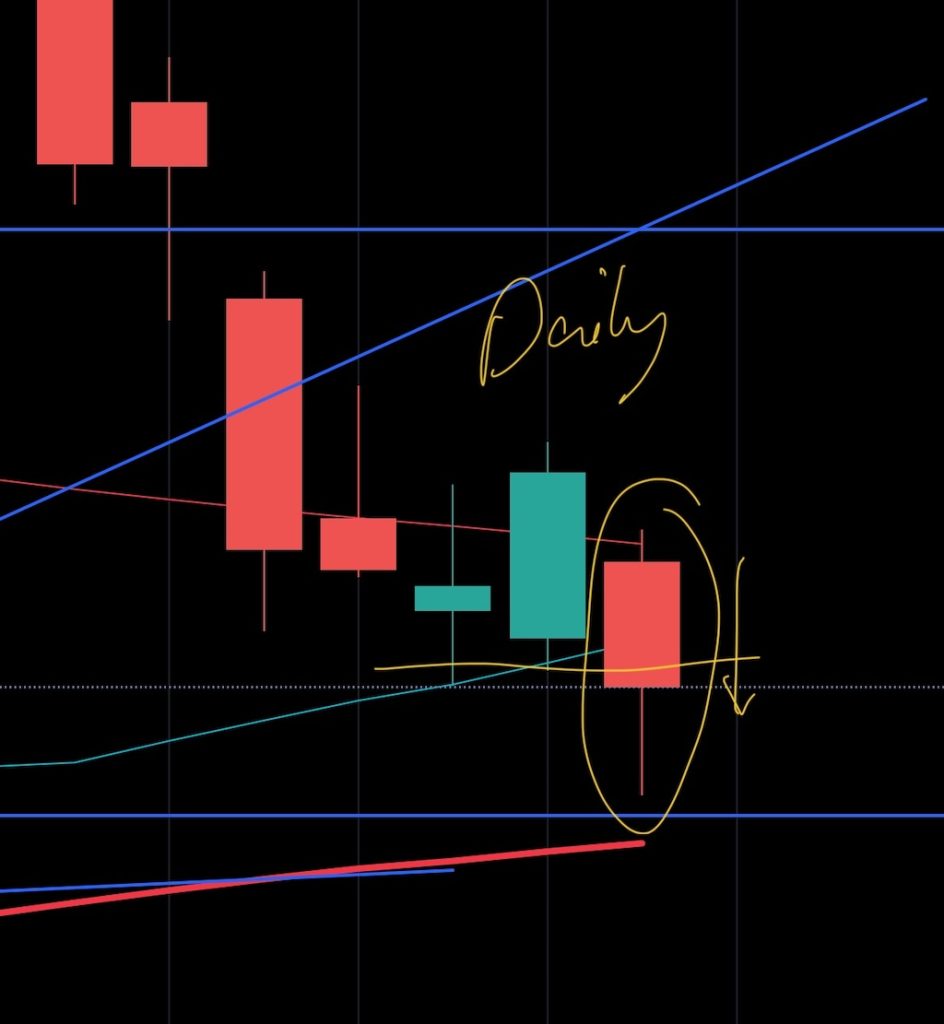
Daily Chart

Red candle that rejected the prior green candle. Day range was average.
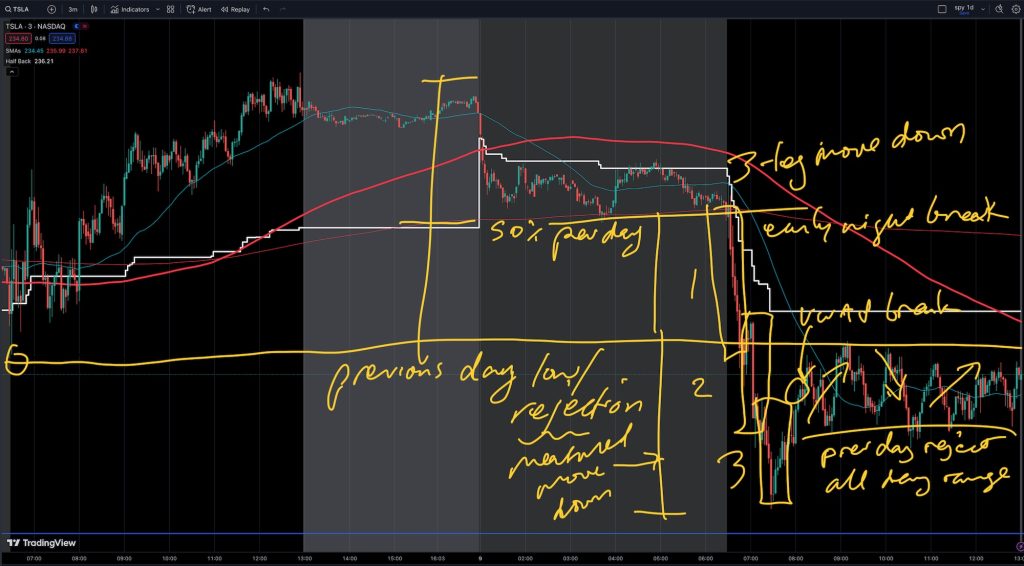
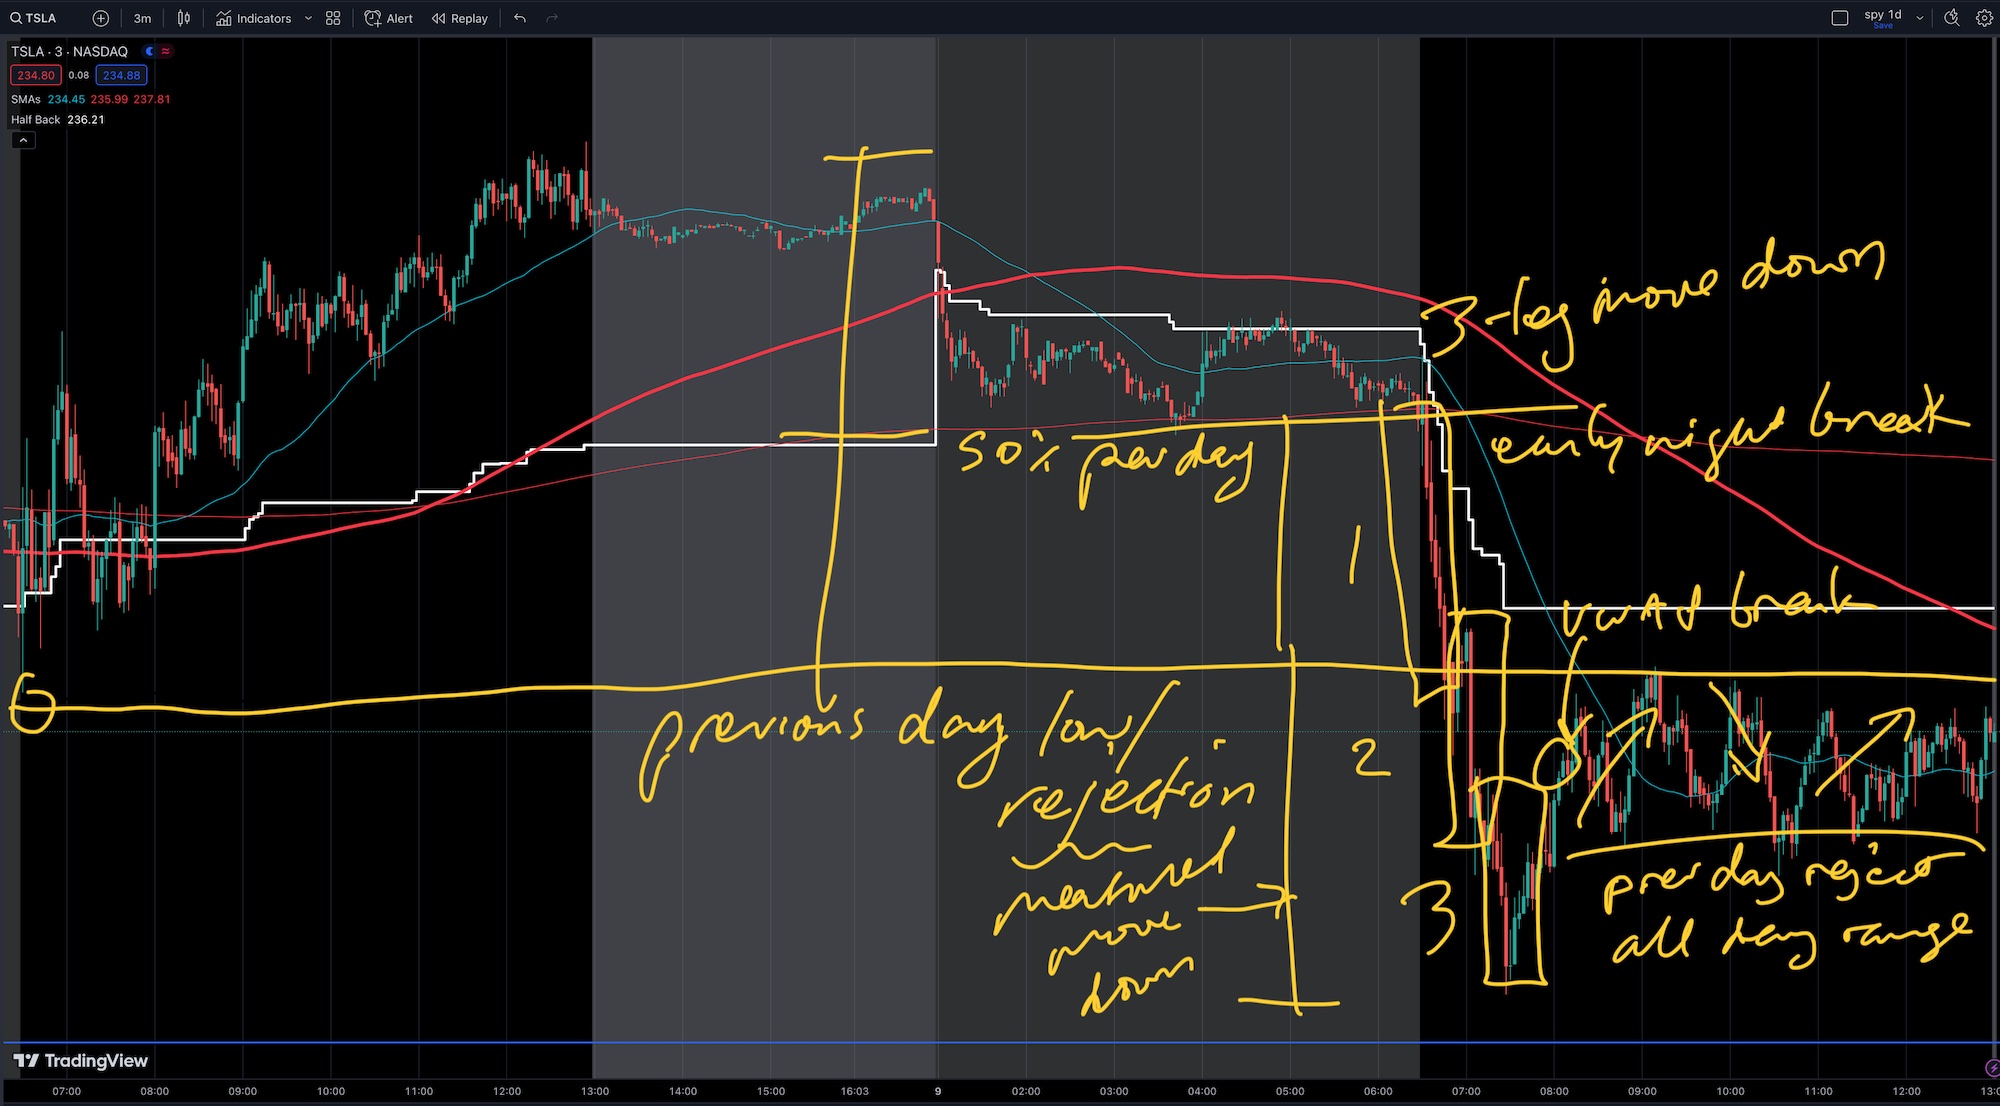
3-Minute Chart

Night range low was 50% level of prior day. Early break below night range. Early downward direction with 3 pushes. Downward ended at a bounce at the pivot at the 1 hour mark. Bottom was a measured move down from the night range break. That was followed by a VWAP break upward, then ranging just below the prior day low most of the day. No 50/200 moving average crosses, like yesterday, but in the other direction.
Strategy
Short at prior day low. Likely ranging after VWAP break.
Happy trading.
(This post is for entertainment purposes and is not investment advice. You can lose money in the stock market.)
